If it has not already done so, China is now poised to overtake the United States as the world’s largest economy. For Latin America and the Caribbean (LAC), this has created an opportunity to diversify trade relationships away from traditional dependence on the United States. In fact, China more than quadrupled its share of LAC exports between 2002 and 2012. (Data for this article is from the Economic Commission on Latin America and the Caribbean (ECLAC), the Food and Agriculture Organization (FAO), the IMF, UN COMTRADE, and the U.S. Geological Survey, and various scholarly works, as well as the author’s calculations. References are available from NACLA.)
This broader export market was an important factor in the LAC region’s relative stability in the face of the recent global recession (see Ray and Kozameh ‘s “Surviving the Global Recession,” NACLA Report, Summer 2012). But such export booms carry significant risks for the countries involved, and the LAC-China boom is no exception. LAC governments may want to approach the boom strategically and cautiously, taking advantage of potential benefits while limiting economic, social, and environmental risks.
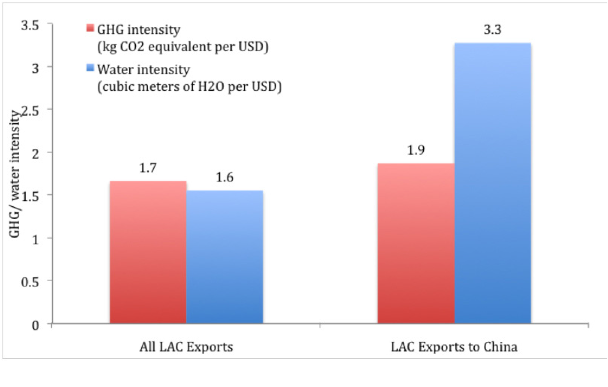
One obvious risk is that China may cool as a market as its GDP growth slows from the double-digit rates common in the previous decade to the more modest (though still quite high by international standards) IMF projections of 6-8% annually. Beyond the volatility of markets that slower growth might bring about, as long as China continues to grow as a market for LAC exports, LAC countries are likely to face a higher environmental footprint and smaller employment benefits as the LAC-China trade puts pressure on the overall regional economy toward fewer jobs, using more water and emitting more greenhouse gases (see figure 2).
An important risk factor lies in the unbalanced composition of LAC’s exports. China isn’t simply importing more of everything from LAC; its surge in imports has focused on strategically important raw materials like petroleum and soybeans. This new focus comes from two recent Chinese policy shifts. First, the “Go Out” (or “Going Global”) policy has been actively encouraging Chinese firms to invest outside of China and its geographic neighbors since 1999. More recently, a “Two Markets, Two Resources” approach to food security differentiates between strategic staples that China can produce in sufficient quantities at home, and those it needs to continue to import. To facilitate self-sufficiency in the first category, China has shifted away from producing the latter group of commodities and toward importing them instead, especially from countries that are already familiar investment partners from the “Going Global” strategy.
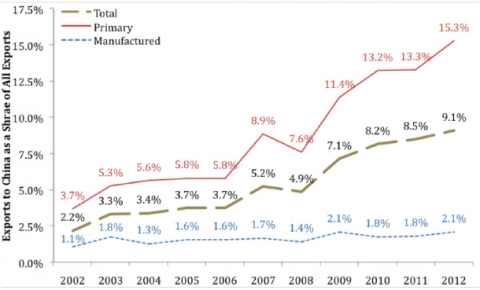
Figure 1 shows the result of these changes for LAC exports to China. In 2002, China consumed 3.7% of LAC’s primary exports and 1.1% of its manufactured exports. By 2012, however, that gap had swelled dramatically, to 15.3% of the region’s primary exports and only 2.1% of manufactured exports.

LAC imports from China have risen at a similar rate, and LAC even developed a trade deficit in goods with China in 2011 and 2012, importing more from China than it exported to China. This new trade deficit was small (0.2% of LAC’s total GDP), but behind this small number is an important insight into the nature of the LAC-China economic relationship: the trade deficit was largely due to price fluctuations. LAC exports to China are particularly vulnerable to these swings because of their concentration in primary materials. From 2008 to 2012, about two-thirds were in iron, oilseeds (such as soybeans), petroleum, and copper (see table 1).
Meanwhile, like much of the world, LAC imports mainly manufactured goods from China. Moreover, these imports are diversified among a broader array of commodities. The top five comprise only about a quarter of the total, and are almost all manufactured goods: telecommunications equipment, boats, data processors, optical instruments, and refined petroleum products. Industrial goods, especially when they are so diverse, have much more stable prices than the commodities that LAC sends to China. So when global commodity prices swing, those swings affect LAC exports to China much more than LAC imports from China, introducing instability into this important economic relationship.

This imbalance in the composition of LAC-China trade means that when prices stagnate or fall, as they have recently, it leaves LAC at risk of “running in place”: selling more goods but without getting more revenue. For two commodities, such as copper and iron, the total value actually fell. Worse than running in place, LAC actually ran backwards in these two cases—selling more but receiving less in exchange.
This heavy emphasis on primary materials is not reflected in overall LAC exports. In fact, from 2008 to 2012 manufactured goods made up about 40% of LAC’s exports to the world. Nor is it reflected in China’s overall imports, which are mostly manufactured. So the importance of primary materials in LAC exports to China is especially notable, because it is unusual for both parties.
The enormous reliance on raw materials in LAC-China exports therefore is not inevitable. It does not reflect a universal rule among LAC exports, and it has not “always been this way.” Instead, its newness and uniqueness gives LAC governments policy space to address the risks involved while taking advantage of the increased revenue.
It is also important to note that on at least two major indicators, LAC exports to China have a larger environmental footprint than the LAC’s trade with the rest of the world. This is because raw material production is more environmentally intensive than manufacturing. While environmental data for developing countries is notoriously scarce, currently available data does allow analysis of two important aspects of environmental performance: water use and greenhouse gas (GHG) emissions.
Applying levels of greenhouse gas emission intensity (as estimated in a Proceedings of the National Academy of Sciences paper by Peters, et al) for each country and commodity to UN trade data results in GHG emissions equivalent to 1.7 kg of CO2 per U.S. dollar for all LAC exports in 2004, compared to 1.9 kg per dollar of just the exports to China: a 12% difference. Exporting to China has a greater impact for climate change.
Similarly, we can apply national water usage data as estimated by the Water Footprint Network—disaggregated by country, agricultural crop and industry—to UN trade data to reveal an overall water intensity of 1.6 cubic meters per U.S. dollar of LAC exports to China, compared to just 0.9 cubic meters per dollar of LAC exports overall, for the mid 2000s. In other words, LAC exports to China are about 50% more water-intensive than overall LAC exports. This is likely to lead to conflict over the use of those resources between exporters and those practicing more traditional livelihoods.

Furthermore, since manufacturing creates more jobs than does the extraction, cultivation, and production of primary goods, the outsized importance of primary products in LAC-China exports also means those trade flows support fewer jobs than other LAC exports. Combining household survey and national accounts data allows for an estimate of the average number of jobs supported by each country’s agriculture, extraction, manufacturing, and other sectors, shown in table 2. Extraction is by far the least labor-intensive of the three major economic sectors. Manufacturing is the highest on a regional level and in most countries, although in Mexico agricultural exports actually support more jobs per million U.S. dollars.
These employment intensity figures include only direct employment (mine workers, for example) rather than also including indirect effects on employment in other sectors (food and services for said mine workers). Estimates for indirect employment effects vary dramatically but consistently show that even with indirect employment effects included, extractive industries support fewer jobs than manufacturing. Extractive industries have relatively high ratios between indirect and direct employment (employment multipliers), but such low direct employment as to make the total employment effects lower than in other sectors. Mining industry groups estimate employment multipliers of 3.4 in Chile and 3.7 in Peru, and government estimates of mining multipliers range from 1.8 in Bolivia to 4.7 in Mexico. Applied to the direct employment data in table 2, these multipliers would only bring the total employment effect from extraction up to the direct employment effect from manufacturing for Chile and Peru. For Bolivia and Mexico, the multipliers would need to be much higher to even reach that level.

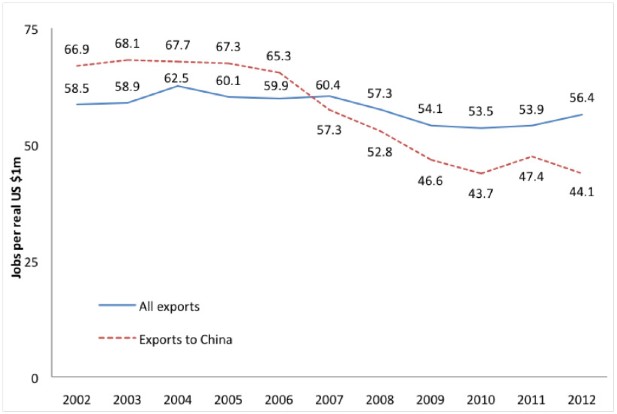
Employment data is available for every year, allowing analysis of changes during the decade. Interestingly, exports to China began the period at a relatively higher level of labor intensity but by 2012 were well below other exports. While overall exports supported between 56 and 61 jobs per million dollars of output, exports to China went from supporting 66.9 to only 44.1 jobs per million dollars of output (see figure 3). If China’s importance as a Latin American export market continues to grow, it will continue to exert downward pressure on the number of jobs supported by each million dollars of exports. This decline in labor intensity creates another “running in place” effect: the LAC must export more to support the same number of jobs.

In the face of the obvious downside to the resource boom, countries across the region are attempting to mitigate the boom’s significant risks in several ways. Some are hedging against the boom’s end by ensuring that financial benefits outlast the boom itself. Bolivia, for example, has accumulated reserves worth 43% of GDP (among the highest in the world). It is also employing a second strategy, addressing the gap in value-added by insisting that new mining concessions be accompanied by processing and refining facilities. Along the same lines, China has joined Ecuador and Venezuela as a partner in the Pacífico petroleum refinery, now under construction and slated to open in Ecuador in 2017. For its part, Ecuador has channeled tremendous amounts of oil-related funds (12% of private oil profits and $1 for every barrel) to public infrastructure in communities near oil facilities.
Finally, other countries are exemplary for using their market power to hold producers accountable for their environmental and social performance. For example, Peru has pursued this approach by joining the Extractive Industries Transparency Initiative and taking steps to comply with Convention 169 of the International Labor Organization to guarantee local communities the right to consultation prior to new development projects.
While policy priorities may differ among LAC countries, and while there is room for the region to expand these risk management strategies, it is extremely encouraging to see nations take such strategic stances. By setting ground rules for this new and important relationship, the LAC region is working toward redefining the resource boom.
Rebecca Ray is a research fellow at Boston University’s Global Economic Governance Initiative and a PhD student in economics at the University of Massachusetts-Amherst.
Read the rest of NACLA's 2014 Fall Issue: Horizontalism & Autonomy

